
Forest are complex, messy habitats. The tired old saw of not being able to see the wood for the trees has an element of truth, because the tangle of material prevents easy measurement and assessment. And that’s without even mentioning the leaves.
Terrestrial laser scanning (also known as ground-based LiDAR) is a great technology for getting round this because it allows us to create full three-dimensional reconstructions of forests, from which we can extract parameters that would be otherwise unavailable to a surveyor on the ground. In this aspect it’s a major advance over traditional techniques of forest surveying, though challenges remain in turning the vast quantities of data into relevant and meaningful measurements that we can use to understand how forests form and what the implications are.

One of our laser scanners in action in a UK woodland. Photo by Joe Ryding. If FARO want to give us a discount for all this free advertising then I’d be very happy to hear from them.
In this post I’d like to focus on some of the findings of our recent paper in Journal of Applied Ecology that might have been overlooked in the media hullabaloo. For a reminder of the major findings, and what I think the implications are for forest conservation, see my earlier post. In any paper, however, there are always some hidden insights that couldn’t be elaborated on in the space available.
In this post I’d like to ask: how much stuff does a forest actually contain? In answering this, our data is perhaps non-intuitive. We split the whole forest into 1 cm cubes then asked whether each contained wood, leaf or neither. Terrestrial laser scanning can’t see inside stems, so instead we measured the surface area of trunks and branches*. Rather than using LiDAR to simply recreate the metrics we can obtain by other techniques, I think the future will be in learning to use these outputs more directly as indices in their own right.
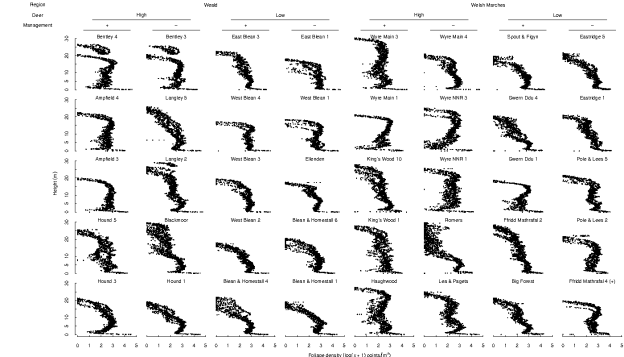
Vertical distribution of foliage in 40 UK woodlands, split into those with either high or low deer densities, and which were either managed or unmanaged.**
Our scans found that woodland plots contained an average (median) density of leaves of 523 cm3/m3. What that means in real terms is only 0.052% of the total forest volume. In other words, although a forest looks like it’s full of foliage, actually it’s mostly empty space. This is necessarily a minimum estimate because we probably failed to detect many leaves higher in the canopy because our laser beams were blocked by other material getting in the way. Even so, if we only detected half of all the foliage in the forest, it would still be less than a tenth of one percent of the total volume.***
If forests are mostly empty space, this has a number of interesting implications, one of which is for the movement of species. For large, lumbering mammals like ourselves, we perceive forests to be difficult to move through, but for small insects they contain vast distances which need to be traversed. Organisms that can fly find this easier, others will depend on physical linkages to help them move around. The amount of stuff in a forest, along with its density and distribution, will have major influences on the mobility of organisms of all sizes.
Another implication is that we can treat the three-dimensional surfaces of forests as area in much the same way as in less complex habitats. This is actually an old idea, with Southwood coining the term ecospace to describe the effective area presented by a habitat, and proposing that this increased area might be responsible for differences in diversity between habitats. For the first time we have a straightforward way to measure the amount of leaf in the forest, which is a metric of how much habitat space there is for the many organisms that feed on or move across them. We could potentially compare this between sites.
We can do the same thing with stems, remembering that our measure is of surface area rather than woody volume. The area of stems in these woodlands was an order of magnitude lower than of foliage, at 49 cm3/m3. This is interesting because it tells us that for species that forage on tree trunks and branches, there is approximately ten times less area available to them than there is for those utilising leaves as habitat.
The Species-Area Relationship (the closest thing ecology has to a law) tells us that the number of species doesn’t increase linearly with area****. Instead, we would expect a 90% reduction in area to mean a roughly 50% reduction in species richness. Is that true? Do we find half as many species of insects, lichens or gleaning birds on bark as we do on leaves? I’d be interested to look. Unfortunately right now we don’t have an easy way to tell live and dead wood apart, which is important because they form habitats for completely different species.
In short, capturing the three-dimensional structure of these forests is just the beginning, and there are all sorts of new avenues which we can explore with these data.
* A range of algorithms exist to convert these into volumes using cylinder fitting, which is the standard approach used if you want to determine either the amount of timber or carbon in a forest. These weren’t part of our objectives so we didn’t, and actually as a measure of habitat structure as experienced by other organisms, surface area might be more relevant.
** Note that these figures are flipped relative to those in the original paper. This is a more intuitive way of looking at the patterns, whereas in the paper the orientation was set to match the statistical analyses.
*** Strictly this is ‘number of 1 cm cubes per cubic metre which contain foliage’. Leaves are flat and much thinner than 1 cm, of course, so the true volume of foliage is much, much lower than this.
**** The actual relationship is S = cAz, where z is a parameter determining the sensitivity of species richness S to area A, and c is a mathematical constant representing the theoretical richness of a single unit of area.

This is really fascinating, Markus. In my first year classes we talk about community structure and how it can be roughly partitioned into physical and biological structure, but that these two aspects are closely related. This is a really nice example and I’ll highlight it to my students. Amazing that such a small volume of plant material can have profound micro-climatic effects.
One question: if you can scan to 1cm cubed resolution, can you differentiate flowers/infloresences on the trees? And maybe the pollinators that are visiting them….?
LikeLiked by 1 person
With our equipment you can scan to 2 mm resolution if you really want. Extracting flowers from this would be extremely difficult, and mobile pollinators completely impossible. We can only describe static elements; even leaves moving in the breeze cause problems.
LikeLiked by 1 person