
Here’s a quick thought experiment. Imagine you have a spare flowerbed in your garden, in which you scatter a handful of seeds across the bare ground. You then ignore them, and come back some months later. What will have happened?* Your expectation might be that you will have a healthy patch of plants, all about the same size. Some might be larger or smaller than average, but overall you’d expect them to be pretty similar. This is known as a unimodal size distribution. They have after all experienced identical conditions.
You’d be wrong. In fact, it’s more likely that your plants will have separated into two or more size groupings. There will be a set of larger plants, spread apart from one another, and which dominate the newly-formed canopy. In between them will be scattered other plants of smaller size. This results in a bimodal (or multimodal) size distribution. There isn’t a standard, expected size; instead there will be different size classes present.
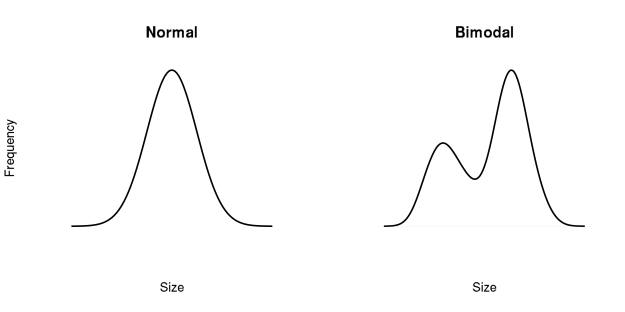
A normal, unimodal distribution of sizes (left) is what you might expect to see when all plants are the same age and growing in the same conditions. In fact it’s more common to see a bimodal size distribution (right), or something even more complicated.
This observation is nothing new. Much was written about the issue from the 1950s through to the 70s, particularly in the context of forest stands. The phenomenon was widely-recognised but remained paradoxical.
I stumbled upon this old literature back in 2010 when I published a small paper based on a birch forest in Kamchatka which showed a clearly bimodal size distribution. I didn’t need to go all the way to Kamchatka to find a stand with this feature; but since I had the data it made sense to use it. I used the spatial pattern of stems to infer that the bimodality was the result of asymmetric competition (i.e. that large trees obtain disproportionately more resources than small trees, which is definitely true in terms of light capture). All the trees were the same age, but the larger stems were spread out, with the smaller stems in the interstices between them. Had the bimodality been the result of environmental drivers we would expect there to be patches of large and small stems, but in fact they were all mixed together.
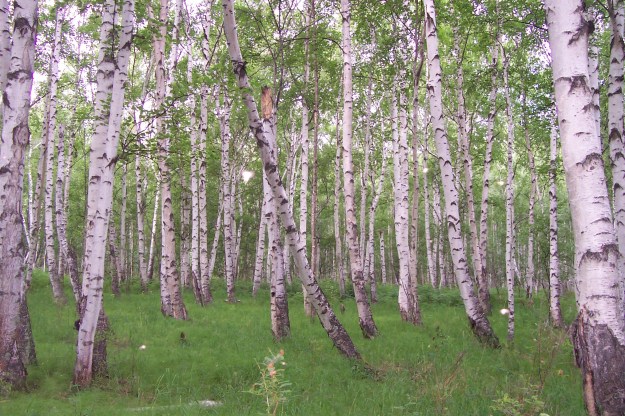
This is the stand of Betula platyphylla with a bimodal size distribution that was described in Eichhorn (2010). If it looks familiar, it’s because the strapline of this blog is a picture of us surveying it. The white lights on the photo aren’t faeries, it’s the reflectance of mosquito wings from the camera flash. So many mosquitoes.
Three things struck me when I was reading the literature. The first was that hardly anyone had thought about multimodal size distributions in cohorts for several decades**. This was a forgotten problem. The second was that the last major review of the phenomenon back in 1987 had concluded that asymmetric competition was the least likely cause — which conflicted with my own conclusions. Finally, I had no difficulty in finding other examples of multimodal size distributions in the literature, but authors kept dismissing them as anomalous. I wasn’t convinced.
Analysing spatial patterns is all well and good but if you want to really demonstrate that a particular process is important, you need to create a model. Enter Jorge Velazquez, who was a post-doc with me at the time but now has a faculty position in Mexico. He built a simple model in which trees occupy fixed positions in space and can only obtain resources from an the area immediately around themselves. Larger trees can obtain resources from a greater area. When two trees are close to one another, their intake areas overlap, leading to competition for resources.

When there are two individual trees (i and j), each of which obtains resources from within a radius proportional to its size m, the overlap is determined by the distance d between them. Within the area of overlap the amount of resources that each receives depends on the degree of asymmetric competition, i.e. how much of an advantage one gets by being larger than the other. This is included in the model as a parameter p described below.
This is where asymmetric competition is introduced as a parameter p. When p = 0, competition is symmetric, and resources are evenly divided between two trees when their intake areas overlap. When p = 1, each tree receives resources in direct proportion to its size (i.e. a tree that’s twice as large will receive two thirds of the available resources). Increasing p makes competition ever more asymmetric, such that the larger competitor receives a greater fraction of the resources being competed for. In nature we expect asymmetric competition to be strong because a taller tree will capture most of the light and leave very little for those beneath it.
We applied the model to data from a set of forest plots from New Zealand which have already been well-studied. Not only did we discover that two thirds of these plots had multimodal size distributions, but also that our model could reproduce them.
We then started running our own thought experiments. What if you changed the starting patterns, making them clustered, random or dispersed? That turned out to have very little effect on size distributions. What about completely regular patterns? That’s when things started to get really interesting.
By testing the model with different patterns we discovered three important things:
- Asymmetric competition is the only process which consistently causes multimodal size distributions within simulated cohorts of plants. Nothing else we tried worked.
- Asymmetric competition is the cause, not the consequence of size differences in the population.
- The separation of modes is determined by the length of time it takes for competition in the cohort to start, which usually reflects the distance between individuals.
- The number of modes reflects the effective number of competitors that each individual has.
What does all this mean? Given that asymmetric competition is normal for plants, I would argue that we should expect to see multimodal size distributions everywhere. In fact, seeing unimodal size distributions should be a surprise. Don’t believe me? Grab some seeds, give it a go, and tell me if I’m wrong.
You can read our new paper on the subject here. If you can’t get hold of a copy then let me know.
* Luckily this is a thought experiment, because in my garden the usual answer is ‘everything has been eaten by slugs’.
** I should stress here that I’m specifically referring to multimodality in size distributions of equal-aged cohorts. When several generations overlap then the distribution of sizes reflects the ages of the individuals. If multiple species are present this adds additional complications, and in fact size distributions of species across communities have been a hot topic in the literature of late. This is very interesting but a completely different set of processes are at work.
