It all began with the best of intentions. By the time the Millennium Ecosystem Assessment was published in 2005, there was already strong evidence that the services nature provided to humanity were in decline, and our degradation and over-exploitation of nature was to blame. We were also acutely aware of rising extinction rates, and biodiversity had long been a cause around which world leaders were prepared to rally.
The missing piece of the puzzle appeared to be obvious: show that biodiversity was good for ecosystem functions and services, and the case for conservation could add raw self-interest to the mix. This was the foundation for thousands of studies of the biodiversity-ecosystem functioning relationship (often shortened to BEF).
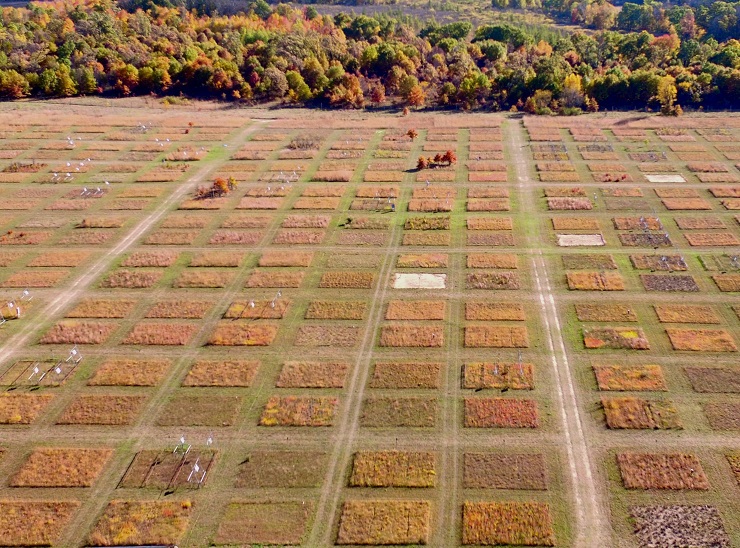
In practice biodiversity was usually translated into species richness. This is of course reductive, but then species richness is often assumed to capture many other aspects of diversity, including traits, phylogeny, resource use and much more. This assumption is seldom directly tested for the set of species under study. Nevertheless it seemed to work. Early evidence of positive effects of species richness from sealed laboratory systems had been replicated in some the most ambitious field experiments in ecology, resulting in countless papers and a growing confidence that more species were a universal good. It also appeared that one of the key benefits was multifunctionality, which meant that the more species you had, the more services they were able to deliver. Everyone came to agree that biodiversity was one of the most important forces shaping ecosystem function. There was even emerging evidence that real-world patterns might be stronger than those in experimental systems, which made sense because we expected ecosystems to be structured in a way that made the roles of species complementary.
Ten years ago I published a textbook with a chapter on why diversity matters which presented this consensus. Prior to publication I sent it to a few colleagues who were active in the BEF literature and they gave it the thumbs-up. Everyone was agreed: more species were always a good thing.
At the moment I’m revising the textbook and finding that the last decade has not been kind to the consensus view. Every bandwagon eventually attracts a backlash, so this is not unexpected, but it creates a challenge for how to effectively synthesise the literature and present a clear story that allows readers to understand and engage with the evidence as it emerges.
First, even after thousands of studies, there is still enormous bias in the evidence base behind BEF research. Most studies are of plants, the main ecosystem function measured is simple productivity, and they are geographically located mainly in temperate zones. The evidence from aquatic systems (marine or freshwater), the tropics or non-invertebrate animals is slight. We should always be cautious about declaring a general rule for which the evidence is not yet general.
Then there’s the problem that experimental results haven’t replicated in the real world. Early reviews were unequivocal: biodiversity was always good, all the time. More recent studies in natural systems have found that while positive effects outweigh negative ones, actually the majority of studies find no effect at all.
To this we can add emerging evidence of ecosystem disservices. There are certainly ways in which biodiversity can be harmful to humans. In some of my own research we found that increased tree cover around rural villages was linked to greater risks of disease by supporting vector populations. Likewise in agriculture, the whole history of intensification has been one of deliberately reducing diversity in fields to boost the necessary service of crop production.
There are also critiques of the ways in which previous studies analysed their data which suggest that they may have over-stated the benefits of biodiversity. While not wanting to get into the technical details, it’s at least worth noting that the fundamental nature of the relationship has come under scrutiny.
Finally, the emerging picture is that species richness isn’t always the main correlate of functioning. Sometimes functional or trait diversity turns out to be more important, and species richness is only an indirect or imperfect means of capturing this. This then leads to another set of questions for which ecological theory leaves us on unsteady ground. Which traits matter, and why? There is a danger of circular reasoning if we end up picking traits because they affect ecosystem functions (try them all and see which works), or because they’re the ones we’re able to measure, without putting a deductive framework in place first. We could end up just creating a new set of problems for the next generation of ecologists.
For some groups of organisms there are standard sets of traits, most notably the Leaf Economic Spectrum for plants, which has been joined by the Wood Economic Spectrum for woody plants and some other developing initiatives. There is a different problem here though, which is that we find that particular environments select for a relatively narrow range of traits. If for example only plants with certain traits can survive in the desert, and deserts have low productivity, is it the environment or the trait diversity that limits productivity? Most ecologists would vote for the former. The pathways of causation become complicated and we need to reflect on whether trait diversity is the cause or a side effect of ecosystem functioning.
Where does this leave us? Perhaps we shouldn’t have expected nature to do any favours for us. We certainly haven’t reciprocated. Quite simply, nature doesn’t care about us. There are interesting fundamental questions to be asked about what structural aspects of natural systems are connected to ecosystem processes, but these need to be addressed without the distorting lens of of activism. There are also plenty of ways to justify conservation of biodiversity without making claims for its benefits to people. We might eventually find ways in which maintaining high biodiversity can be reconciled with our own self-interest, but for now I’m stepping off the BEF bandwagon and waiting for the fog of evidence to clear.
Addendum: make sure you read on to the comments below where some serious experts in BEF help to clarify the issues and provide some genuine insights. There was also an excellent discussion on LinkedIn which included a heap of recommended papers. If you’re as confused about BEF as I am then these are great starting points to find out more.